Today, as the landscape of data visualization moves fast, the method chosen to present information can significantly influence comprehension and decision-making. Two widely used techniques are 2D and 3D visualization. Each has its own strengths and weaknesses, but 3D visualization often stands out for its ability to offer a more immersive and detailed representation of data. This article explores the pros and cons of each method in-depth to help you understand why 3D visualization might be the superior choice for your specific needs.
2D visualization
2D visualization is the traditional method of representing data, employing flat, two-dimensional images such as charts, graphs, and maps.
Pros:
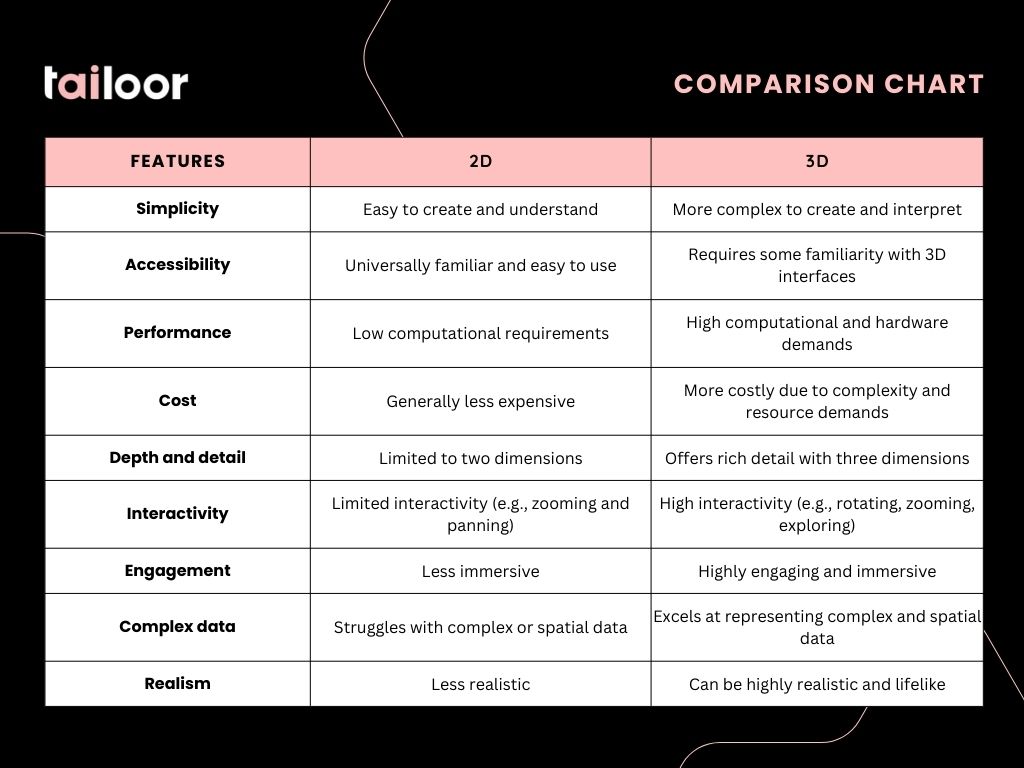
- Simplicity: The greatest strength of 2D visualization lies in its simplicity. Tools like bar graphs, pie charts, and line graphs are straightforward and can be easily interpreted by a broad audience. This simplicity makes 2D visualization ideal for quick, high-level overviews of data.
- Accessibility: Because 2D visualizations are familiar to most people, they are universally accessible and do not require specialized knowledge to understand. This makes them effective for communication in diverse settings, from boardroom presentations to educational classrooms.
- Performance: 2D visualizations generally require less computational power, which means they can be rendered quickly and easily on most devices. This efficiency is particularly beneficial when working with large data sets or in environments where computational resources are limited.
- Cost-Effective: Creating 2D visuals is typically less expensive and time-consuming compared to 3D visuals. Tools for generating 2D charts and graphs are often readily available and user-friendly, reducing the need for specialized skills or expensive software.
Cons:
- Limited depth: The primary drawback of 2D visualization is its inability to represent complex data sets with depth. For data that involves multiple variables or intricate relationships, 2D visualizations can oversimplify and fail to capture the full picture.
- Engagement: 2D visuals may not be as engaging or immersive as 3D visuals. This can be a significant disadvantage in fields where capturing the viewer’s attention is crucial, such as marketing, education, or interactive presentations.
- Context: Without the ability to manipulate the view, 2D visuals often miss out on providing a comprehensive context, especially for spatial or geospatial data. Users are limited to a fixed perspective, which can obscure important insights.
3D visualization
3D visualization, on the other hand, employs three-dimensional models to represent data, offering a more dynamic and immersive experience.
Pros:
- Depth and detail: 3D visualizations offer a richer representation of data, showcasing depth and additional dimensions that 2D visuals cannot. This is particularly useful in fields like medicine, engineering, and environmental science, where understanding spatial relationships is critical.
- Interactivity: One of the standout features of 3D visualization is its interactivity. Users can manipulate 3D models by rotating, zooming, and exploring different perspectives, which enhances their understanding and engagement with the data. This interactive capability is invaluable for training, simulation, and exploratory data analysis.
- Realism: 3D visuals can provide a more realistic and immersive experience. For instance, architects and urban planners use 3D models to create lifelike representations of buildings and cities, enabling stakeholders to visualize projects before they are built.
- Complex data representation: 3D visualization excels at representing complex data sets and spatial information. In scientific research, for instance, 3D models can illustrate intricate biological structures or geological formations in ways that 2D representations cannot.
Cons:
- Complexity: Creating and interpreting 3D visualizations can be more complex. This often requires specialized skills and software, which can be a barrier for some users. However, as technology advances, these tools are becoming more user-friendly and accessible.
- Performance demands: 3D visualizations typically require more computational power and advanced hardware to render efficiently. This can be a limiting factor for organizations with limited IT resources or for applications that need to run on mobile devices or over the web.
- Cost: The development of 3D visuals can be more costly and time-consuming compared to 2D visuals. This is due to the need for specialized software, increased computational resources, and potentially longer development times.
Conclusions
While 2D visualization has its place, especially for simple and quick data representation, 3D visualization provides a deeper, more engaging, and detailed approach. The ability to interact with data in three dimensions significantly enhances understanding and decision-making, making 3D visualization the better choice for many applications. This is particularly true in fields that deal with complex data sets or require a high level of detail and realism, such as engineering, architecture, medical imaging, and geospatial analysis.
As technology continues to advance, the tools and resources needed for creating 3D visualizations are becoming more accessible and cost-effective. This trend suggests that the adoption of 3D visualization will grow, providing even more powerful tools for data analysis and presentation. Investing in 3D visualization capabilities can offer significant returns by enhancing the clarity, impact, and engagement of your data presentations.