
Why Complex Catalogs Need More Than a Configurator
A 3D product configurator that only shows — but doesn't tell you anything — is half a tool. The brands that gain the most from configuration technology are those that treat every customer interaction with the configurator as a data point: what they selected, what they abandoned, what they bought, what they returned.
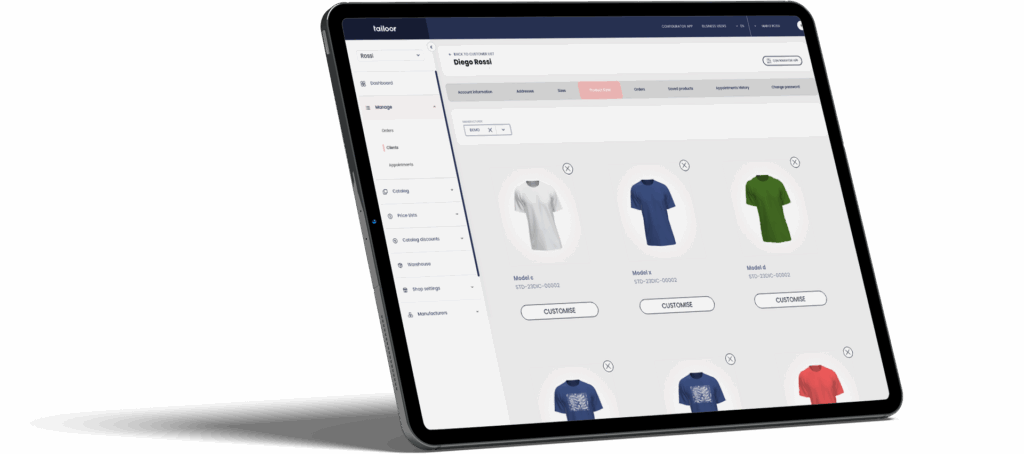
Tailoor's Visual Commerce Data Hub is the analytics and intelligence layer built into the Tailoor platform — connecting photorealistic 3D configuration with a real-time dashboard for configuration behavior, order performance, and catalog intelligence. For fashion, accessories, jewelry, and furniture brands managing complex catalogs, it transforms the configurator from a UX feature into a business decision engine.
1. Why Complex Catalogs Need More Than a Configurator
For brands with hundreds of materials, dozens of product lines, and thousands of possible configurations, the configurator is the most data-rich touchpoint in the entire customer journey. Every option selection, every comparison, every abandoned configuration is a signal about what your customers actually want — and most brands let this data disappear.
The gap between what a catalog offers and what customers actually configure is rarely analyzed. Brands invest in expanding their material library, adding new product lines, and building out configuration options — often without knowing which of those investments are driving revenue and which are generating complexity without return.
The most valuable question a complex catalog brand can ask is not "What can our configurator show?" but "What are customers actually configuring — and what does that tell us about what we should make next?"
2. What the Tailoor Visual Commerce Data Hub Tracks
The Data Hub captures three categories of intelligence, each with direct operational and strategic implications:
Configuration behavior
Which options are selected most often. Which combinations are explored but not completed. Where customers drop off in the configuration flow. Which variants are never selected.
Order performance
Which configurations convert to orders. Average order value by material combination, product category, and customer segment. Return rates by configuration. Remake rates.
Catalog intelligence
Which options are requested but not available. Which materials drive the highest AOV. Which product combinations are trending. Where the catalog has gaps vs demand.
Session analytics
Time spent in configuration. Number of variants compared before purchase. Most common configuration paths. Impact of visualization quality on completion rate.
Customer profiles
Configuration history by customer. Preference patterns across sessions. Segments based on configuration behavior. Most loyal configuration patterns.
Production alignment
Which configurations generate the most production complexity. Which options cause the most errors or remakes. Where constraints engine interventions are most frequent.
3. From Data to Decision: How Brands Use Configuration Analytics
The intelligence generated by the Data Hub connects to five specific decisions that fashion, accessories, and furniture brands make regularly — and typically make with incomplete information:
Assortment and product development
Configuration analytics reveals the gap between what customers want to configure and what the catalog allows them to configure. When a specific material combination is frequently explored but not available, that is a direct signal for the product team — not a hypothesis, but evidence from actual customer behavior. Brands using this data can build capsule collections around demonstrated demand rather than assumed trends.
Pricing and AOV optimization
The Data Hub shows which configuration options — materials, finishes, add-ons — correlate with the highest order values. This enables structured upsell logic: surfacing premium options at the moments in the configuration flow where customers are most likely to upgrade. For jewelry and accessories brands, this typically yields a measurable increase in average order value within weeks of implementation.
Return reduction
Cross-referencing configuration data with return data reveals specific combinations that generate disproportionate returns — often because the product doesn't match what the visualization suggested. This allows targeted improvement of rendering quality for high-return combinations, or the addition of production constraints to prevent orders that consistently result in remakes.

Marketing and content
The most-configured combinations are also the highest-demand combinations. Featuring them in email campaigns, social content, and paid ads connects marketing to actual customer preference data — rather than the internal team's assumptions about what customers want. Configuration analytics essentially provides a continuously updated brief for the creative team.
Inventory and production planning
For brands with any degree of pre-production, configuration data is a leading indicator of demand. Which materials will be needed, in what quantities, and which combinations are trending — all of this becomes predictable from configuration behavior before orders are even placed. Even pure made-to-order brands benefit from this data for supplier negotiation and material procurement planning.
4. The Platform: AI 3D Configurator + Data Hub
The Data Hub is not a standalone analytics tool — it is the intelligence layer of a fully integrated platform. The value it generates depends on the quality of the configurator it is connected to. A configurator that shows low-quality renders or doesn't enforce production constraints generates configuration data that doesn't reflect real purchase intent. The Data Hub is only as useful as the configurator is accurate.
The full Tailoor stack
› AI 3D Configurator — photorealistic rendering, production constraints, modular configuration
› Virtual Try-On — face/body mapping for wearable products and accessories
› Digital Twin of the Customer — persistent profiles for personalized configuration and analytics segmentation
› Visual Commerce Data Hub — configuration behavior, order performance, catalog intelligence in one dashboard
› Made-to-Order integration — configuration connects to production automatically; Data Hub captures production performance data
› CRM export — configuration and customer data exportable to existing CRM and BI tools
5. Use Cases by Category
Fashion & apparel
- Track which fabric/color combinations drive highest conversion
- Identify drop-off points in size and fit configuration
- Cross-reference VTO usage with return rates by garment category
- Build capsule collections from most-configured combinations
Accessories & bags
- Identify most-requested hardware/leather pairings not in catalog
- Track AOV impact of premium material options
- Measure which configuration paths lead to highest loyalty
Jewelry & luxury
- Track stone/metal/setting combinations by conversion rate
- Identify which VTO interactions correlate with purchase confidence
- Measure impact of gem brilliance rendering on AOV
- Identify high-value bespoke configurations for atelier follow-up
Furniture & design
- Track which modular combinations are explored but abandoned
- Identify dimension/material combinations with highest return rates
- Measure AR usage impact on conversion for high-value pieces
- Surface trending combinations for visual merchandising
5 decisions the Data Hub makes smarter
- Product development: Build what customers actually configure, not what the team assumes they want
- Pricing strategy: Identify which options drive AOV and structure upsell logic accordingly
- Return reduction: Find which combinations generate returns and fix visualization or add constraints
- Marketing content: Feature the most-configured combinations in campaigns with proven demand signal
- Production planning: Use configuration data as a leading indicator for material procurement and supplier management
Frequently Asked Questions
The configurator captures what customers want. The Data Hub turns that into what you should build, price, market, and produce next. Together, they make complex catalog management a competitive advantage rather than an operational burden.